
Car Running Costs
Made for drivers who want to know what the car really costs.
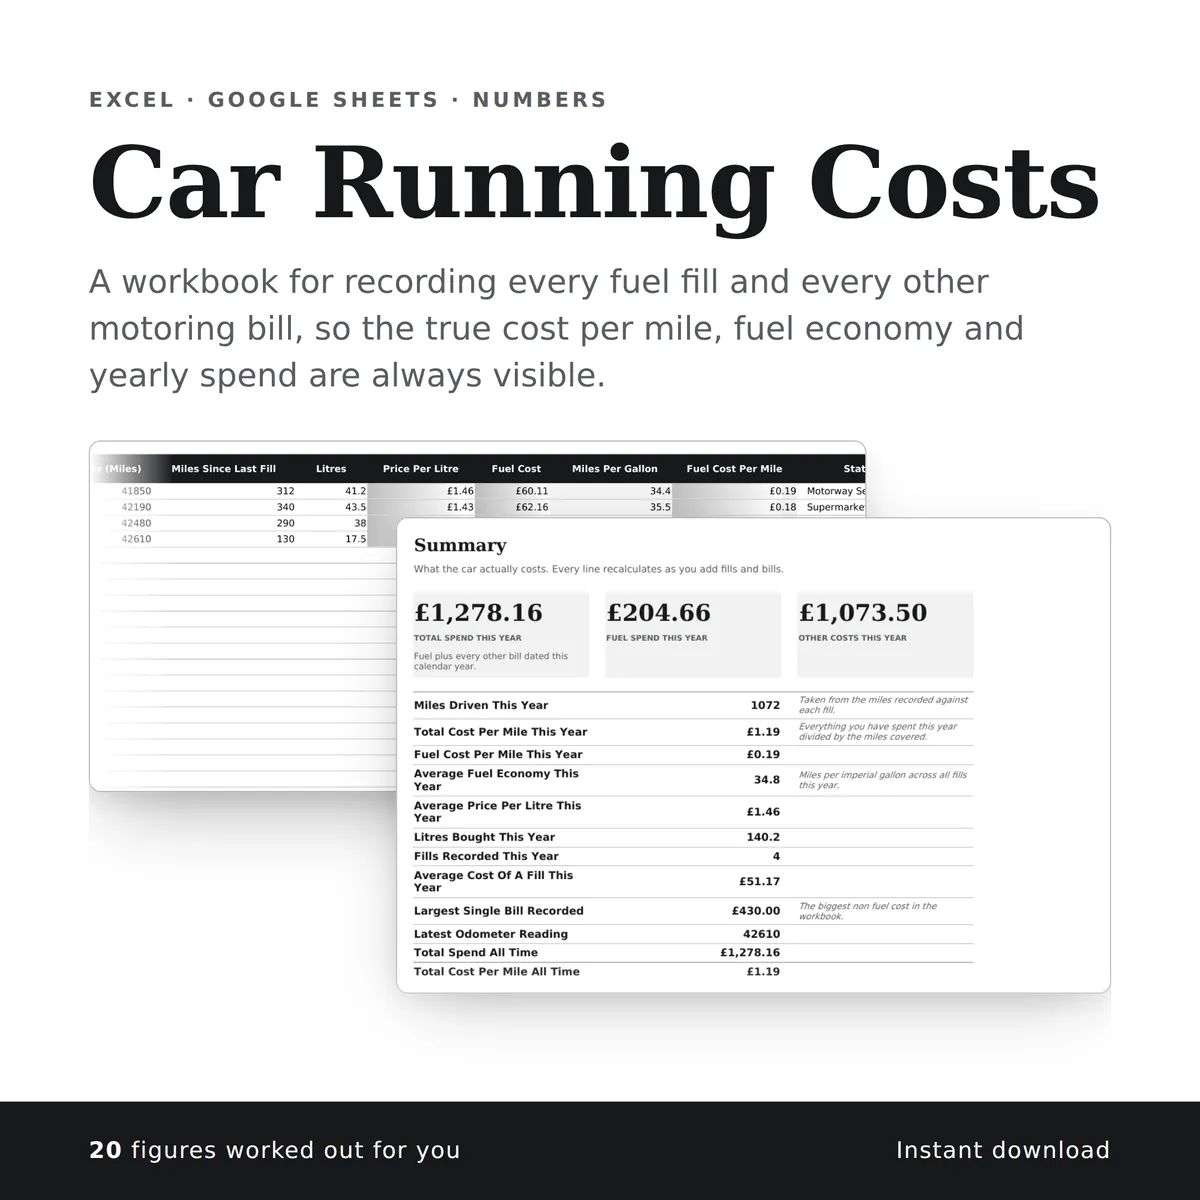
A workbook for recording every fuel fill and every other motoring bill, so the true cost per mile, fuel economy and yearly spend are always visible. The summary carries a chart that redraws itself as you type.
Of the 19 columns, you fill in 14 and the other 5 work themselves out, and all 15 figures on the summary do too. There is room for 650 rows of your own.
£4.99one payment, yours to keep
- Opens in Excel, Google Sheets and Numbers
- Delivered straight away
- No macros, nothing to install
- Change it free before you buy
Payment is handled by Stripe. Your card details go to them and never to us. Sales are final, which is why every tab, column and calculation is shown on this page first.
Already have a spreadsheet of your own? Check it for mistakes, free.
- A new row is typed into the Other Costs tab, one cell at a time, in the white cells a person fills in.
- The shaded cells in that row fill themselves in.
- The figures on the Summary tab change to include the new row.
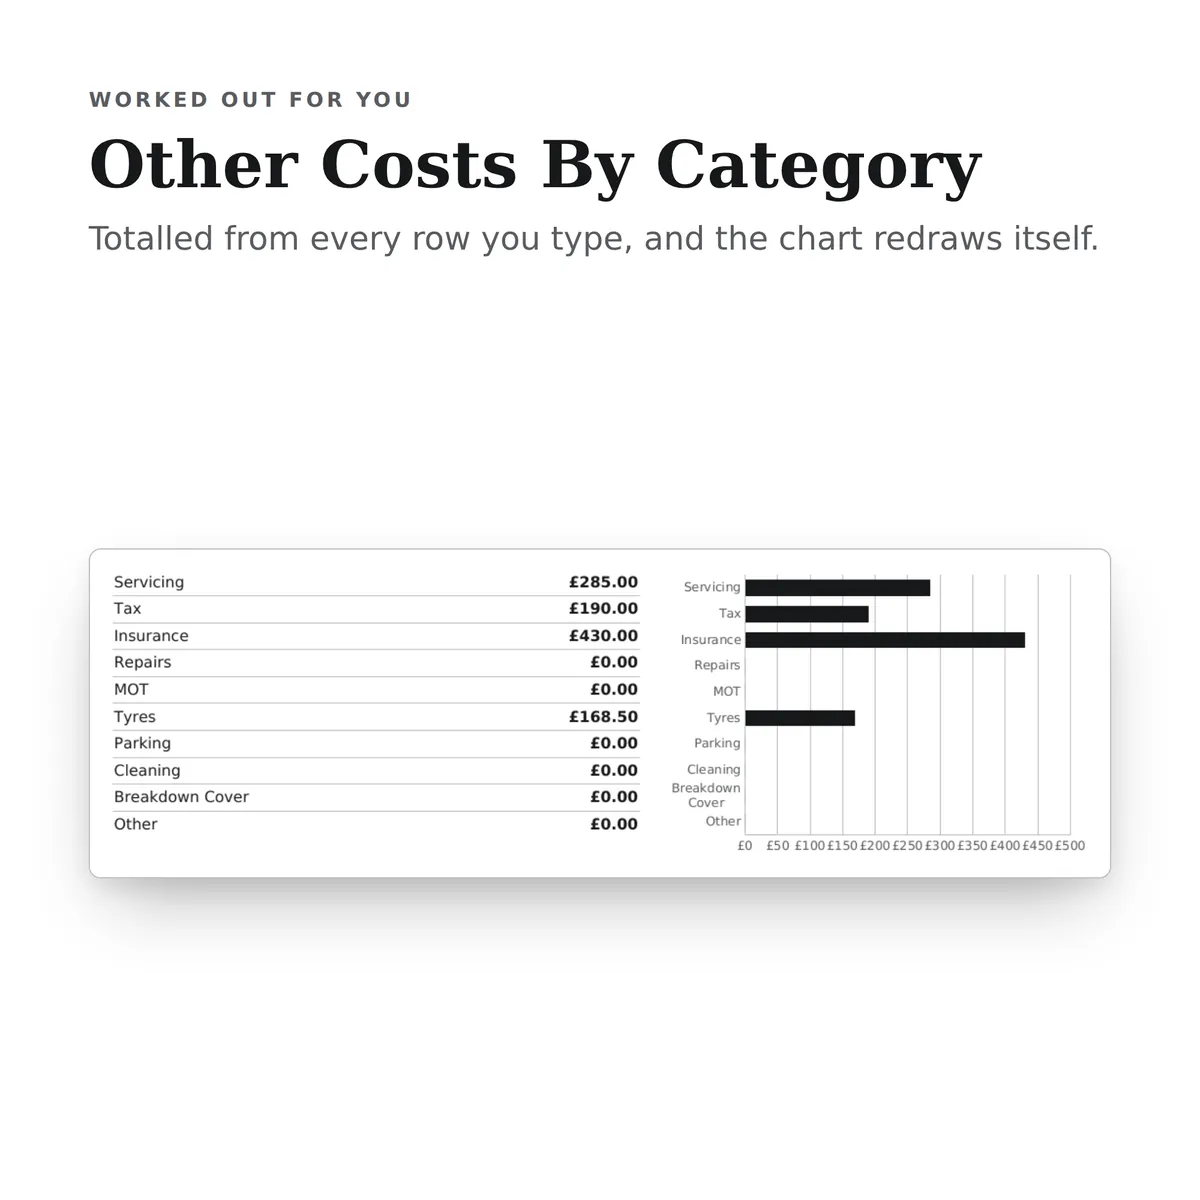
- The chart, Other Costs By Category, redraws with it.
Everything inside, before you pay
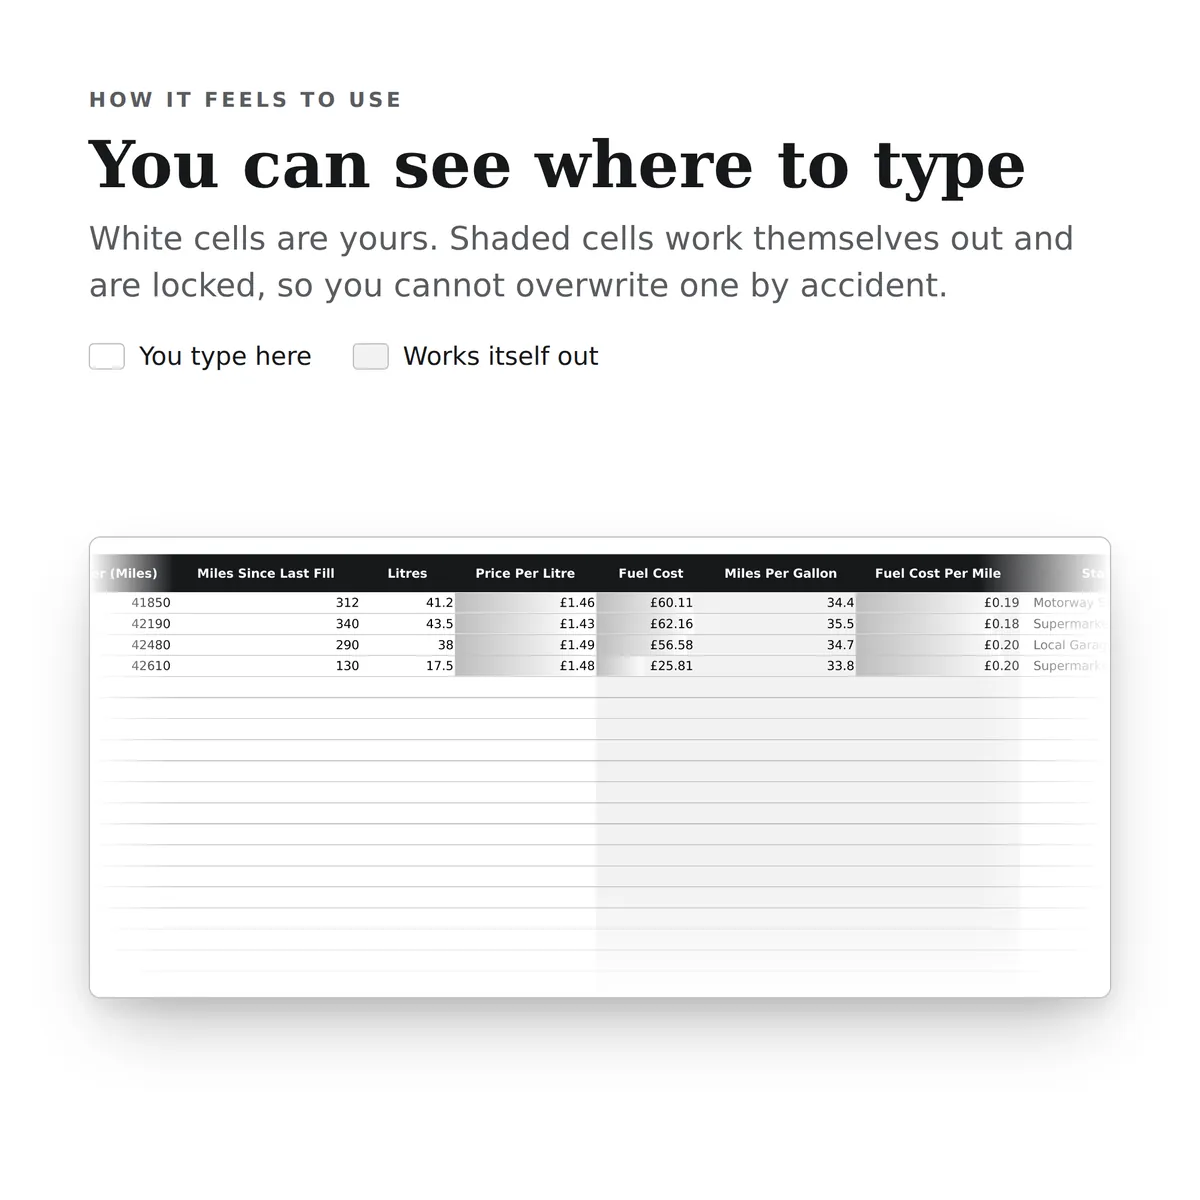
This is the whole design: every tab, every column and how each calculated one is worked out. White cells are yours to fill in; the shaded ones work themselves out and are locked so a formula cannot be overwritten by accident. There is room for 650 rows. Open any tab to see its columns.
Fuel Log
11 columns
| Column | What goes in it | Worked out as |
|---|---|---|
| Date | Type a date. | |
| Odometer (Miles) | The total mileage shown on the dashboard at the moment of filling.Type a number. | |
| Miles Since Last Fill | Take this from the trip meter, or subtract the previous odometer reading from this one.Type a number. | |
| Litres | Type a number. | |
| Price Per Litre | The pump price, for example 1.459.Type an amount in £. | |
| Fuel Cost | Fills itself in. | The Litres times the Price Per Litre. The formulaIF(OR(ISBLANK([litres]),ISBLANK([price_per_litre])),"",ROUND([litres]*[price_per_litre],2)) |
| Miles Per Gallon | Imperial gallons, worked out from the miles and litres on this row.Fills itself in. | The Miles Since Last Fill times 4.54609 divided by the Litres. The formulaIF(OR(ISBLANK([litres]),ISBLANK([miles_since_last])),"",ROUND(IFERROR([miles_since_last]*4.54609/[litres],0),1)) |
| Fuel Cost Per Mile | Fills itself in. | The Litres times the Price Per Litre divided by the Miles Since Last Fill. The formulaIF(OR(ISBLANK([litres]),ISBLANK([price_per_litre]),ISBLANK([miles_since_last])),"",ROUND(IFERROR([litres]*[price_per_litre]/[miles_since_last],0),3)) |
| Station | Type any text. | |
| Fill Type | Economy figures are most accurate when every fill is a full tank.Pick one: Full tank or Partial fill. | |
| Year | Used by the summary to pick out this year's rows.Fills itself in. | Worked out from this row's Date. The formulaIF(ISBLANK([date]),"",TEXT([date],"YYYY")) |
Other Costs
8 columns
| Column | What goes in it | Worked out as |
|---|---|---|
| Date | Type a date. | |
| Category | Pick one: Servicing, Tax, Insurance, Repairs, MOT, Tyres, Parking, Cleaning, Breakdown Cover or Other. | |
| Description | Type any text. | |
| Paid To | Type any text. | |
| Amount | Type an amount in £. | |
| Odometer (Miles) | Handy for service history. Leave blank if you did not note it.Type a number. | |
| Next Due | For anything that repeats, such as tax, insurance or the MOT.Type a date. | |
| Year | Used by the summary to pick out this year's rows.Fills itself in. | Worked out from this row's Date. The formulaIF(ISBLANK([date]),"",TEXT([date],"YYYY")) |
Summary
15 figures
| Figure | Worked out as |
|---|---|
| Total Spend This Year | Fuel plus every other bill dated this calendar year. Worked out from Year and Fuel Cost on Fuel Log and Year and Amount on Other Costs. The formulaROUND(SUMIF([Fuel Log!year_label],TEXT(TODAY(),"YYYY"),[Fuel Log!fuel_cost])+SUMIF([Other Costs!year_label],TEXT(TODAY(),"YYYY"),[Other Costs!amount]),2) |
| Fuel Spend This Year | Worked out from Year and Fuel Cost on Fuel Log. The formulaROUND(SUMIF([Fuel Log!year_label],TEXT(TODAY(),"YYYY"),[Fuel Log!fuel_cost]),2) |
| Other Costs This Year | Worked out from Year and Amount on Other Costs. The formulaROUND(SUMIF([Other Costs!year_label],TEXT(TODAY(),"YYYY"),[Other Costs!amount]),2) |
| Miles Driven This Year | Taken from the miles recorded against each fill. Worked out from Year and Miles Since Last Fill on Fuel Log. The formulaSUMIF([Fuel Log!year_label],TEXT(TODAY(),"YYYY"),[Fuel Log!miles_since_last]) |
| Total Cost Per Mile This Year | Everything you have spent this year divided by the miles covered. Worked out from Year, Fuel Cost and Miles Since Last Fill on Fuel Log and Year and Amount on Other Costs. The formulaROUND(IFERROR((SUMIF([Fuel Log!year_label],TEXT(TODAY(),"YYYY"),[Fuel Log!fuel_cost])+SUMIF([Other Costs!year_label],TEXT(TODAY(),"YYYY"),[Other Costs!amount]))/SUMIF([Fuel Log!year_label],TEXT(TODAY(),"YYYY"),[Fuel Log!miles_since_last]),0),3) |
| Fuel Cost Per Mile This Year | Worked out from Year, Fuel Cost and Miles Since Last Fill on Fuel Log. The formulaROUND(IFERROR(SUMIF([Fuel Log!year_label],TEXT(TODAY(),"YYYY"),[Fuel Log!fuel_cost])/SUMIF([Fuel Log!year_label],TEXT(TODAY(),"YYYY"),[Fuel Log!miles_since_last]),0),3) |
| Average Fuel Economy This Year | Miles per imperial gallon across all fills this year. Worked out from Year, Miles Since Last Fill and Litres on Fuel Log. The formulaROUND(IFERROR(SUMIF([Fuel Log!year_label],TEXT(TODAY(),"YYYY"),[Fuel Log!miles_since_last])*4.54609/SUMIF([Fuel Log!year_label],TEXT(TODAY(),"YYYY"),[Fuel Log!litres]),0),1) |
| Average Price Per Litre This Year | Worked out from Year, Fuel Cost and Litres on Fuel Log. The formulaROUND(IFERROR(SUMIF([Fuel Log!year_label],TEXT(TODAY(),"YYYY"),[Fuel Log!fuel_cost])/SUMIF([Fuel Log!year_label],TEXT(TODAY(),"YYYY"),[Fuel Log!litres]),0),3) |
| Litres Bought This Year | Worked out from Year and Litres on Fuel Log. The formulaROUND(SUMIF([Fuel Log!year_label],TEXT(TODAY(),"YYYY"),[Fuel Log!litres]),2) |
| Fills Recorded This Year | Worked out from Year on Fuel Log. The formulaCOUNTIF([Fuel Log!year_label],TEXT(TODAY(),"YYYY")) |
| Average Cost Of A Fill This Year | Worked out from Year and Fuel Cost on Fuel Log. The formulaROUND(IFERROR(SUMIF([Fuel Log!year_label],TEXT(TODAY(),"YYYY"),[Fuel Log!fuel_cost])/COUNTIF([Fuel Log!year_label],TEXT(TODAY(),"YYYY")),0),2) |
| Largest Single Bill Recorded | The biggest non fuel cost in the workbook. The largest Amount on Other Costs. The formulaIFERROR(MAX([Other Costs!amount]),0) |
| Latest Odometer Reading | The largest Odometer (Miles) on Fuel Log. The formulaIFERROR(MAX([Fuel Log!odometer]),0) |
| Total Spend All Time | Worked out from Fuel Cost on Fuel Log and Amount on Other Costs. The formulaROUND(SUM([Fuel Log!fuel_cost])+SUM([Other Costs!amount]),2) |
| Total Cost Per Mile All Time | Worked out from Fuel Cost and Miles Since Last Fill on Fuel Log and Amount on Other Costs. The formulaROUND(IFERROR((SUM([Fuel Log!fuel_cost])+SUM([Other Costs!amount]))/SUM([Fuel Log!miles_since_last]),0),3) |
More in Money
-

Monthly Household Budget
Set a monthly budget for each category, record what you actually spend and earn, then see where you went over, what is left and how much you saved.
26 figures work themselves out£4.99
-
Bill Payment Tracker
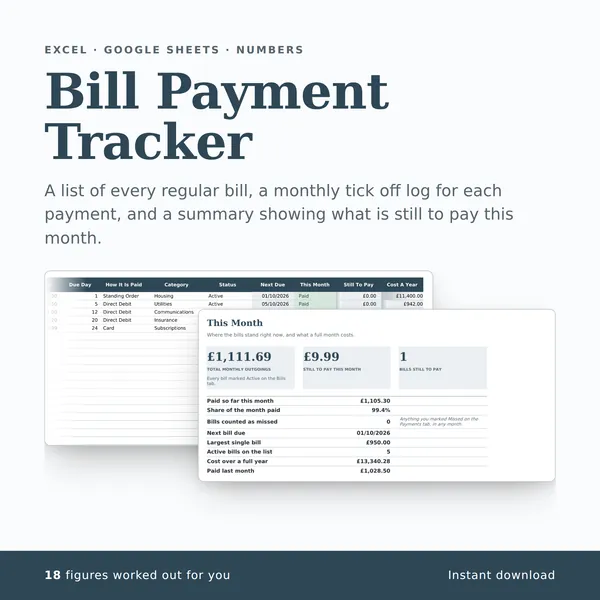
A list of every regular bill, a monthly tick off log for each payment, and a summary showing what is still to pay this month.
18 figures work themselves out£4.99
-
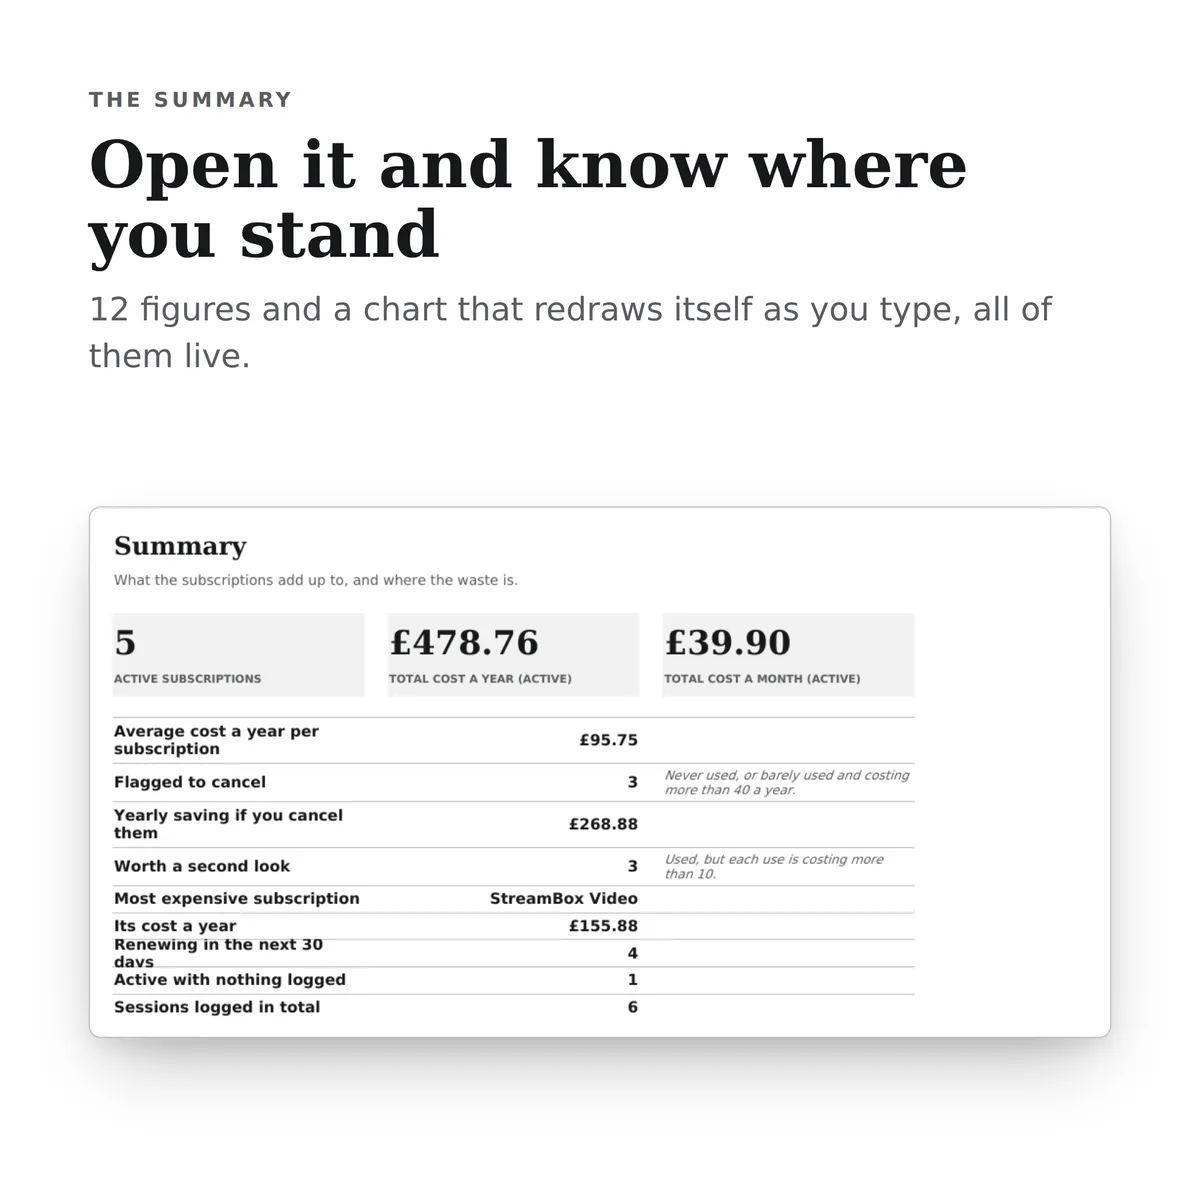
Subscription Review
A workbook for listing every subscription, what it really costs a year, how often it gets used, and which ones are worth cancelling.
19 figures work themselves out£4.99
-
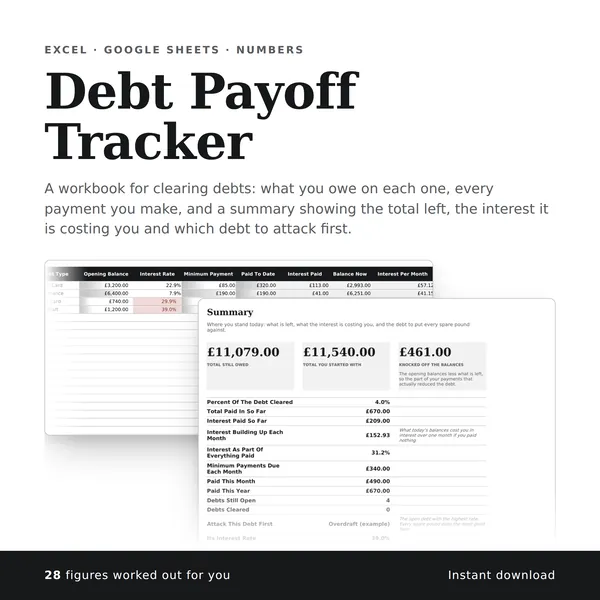
Debt Payoff Tracker
A workbook for clearing debts: what you owe on each one, every payment you make, and a summary showing the total left, the interest it is costing you and which debt to attack first.
28 figures work themselves out£4.99